How To Trace Your System Calls On Mac OS

DTruss
DTruss is analog of strace in linux and uses DTrase for it. It allows you to trace system calls from a running process or run a process with tracing.
Note
But from past versions of Mac OS, some paths are protected by SIP(System Integrity Protection) (i.e. /usr/bin) and cannot be traced. But there is a workaround, to change settings in recovery mode but I would not recommend it to you. Then you can trace only applications which are not under SIP protection.
Examples
run and examine the “df -h” command
dtruss df -h
examine PID 1871
dtruss -p 1871
examine all processes called “tar”
dtruss -n tar
run test.sh and follow children
dtruss -f test.sh
run the “date” command and print elapsed and on cpu times,
dtruss -eo date
If you need to dive deeper you can check DTrace directly. DTrace is a powerful tool for real-time profiling applications and kernel. You can check it here
Instruments
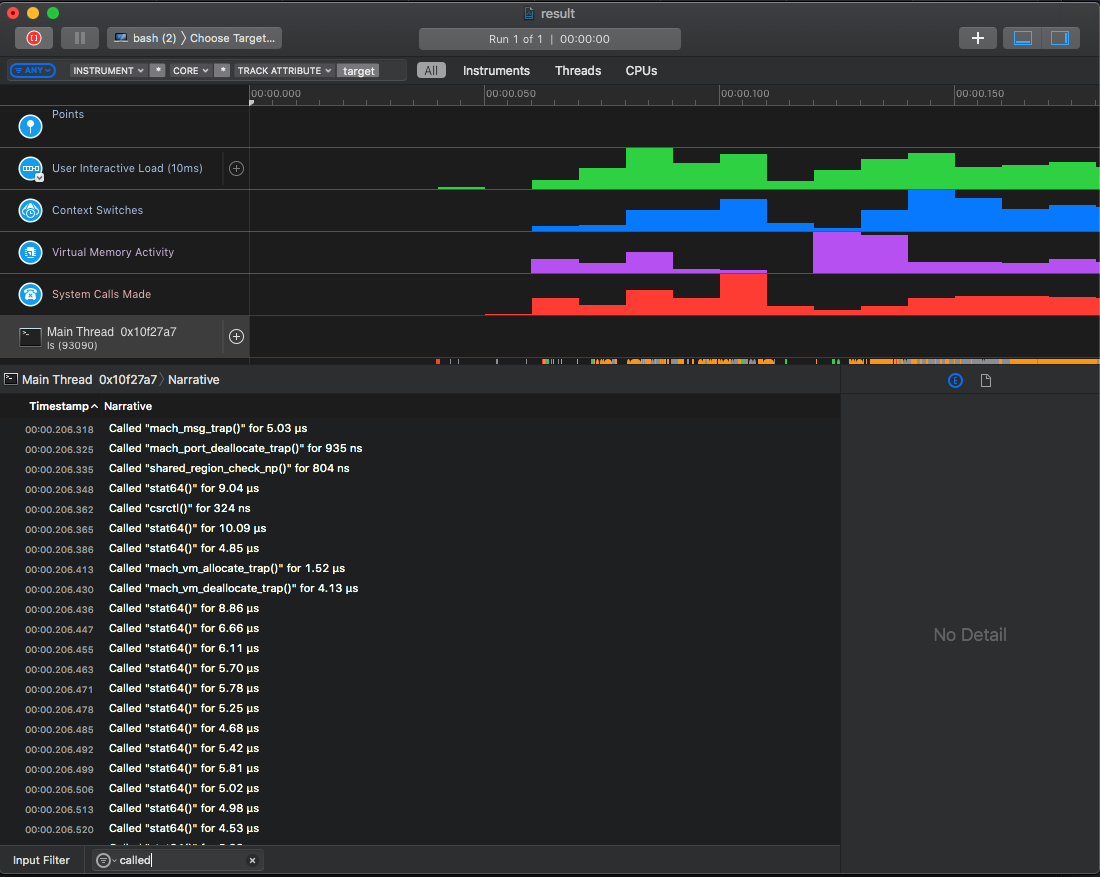
As an alternative, you can try to use Instruments which is an XCode application (Manual).
Trace system calls and saves it in result.trace
instruments  -d result.trace -t 'System Trace' /bin/ls
open result.trace
