PPROF. Profiling Golang Applications.

Setup
Go Tools provide quite a lot of built-in instruments out of the box. Today we’re going to talk about one of them. Pprof
- a built-in profiling tool. There are several ways how to use it. We will check the easiest one.
Check the full code example here.
First of all, we need to import default pprof http endpoints:
import (
	_ "net/http/pprof"
)
If you don’t use http in your application you can just run it standalone:
package main

import (
	"net/http"
	_ "net/http/pprof"
)

func main () {
    http.ListenAndServe(":8081", nil)
}
net/http/pprof has init function with default handlers which can show use basics information about runtime.
func init() {
	http.HandleFunc("/debug/pprof/", Index)
	http.HandleFunc("/debug/pprof/cmdline", Cmdline)
	http.HandleFunc("/debug/pprof/profile", Profile)
	http.HandleFunc("/debug/pprof/symbol", Symbol)
	http.HandleFunc("/debug/pprof/trace", Trace)
}
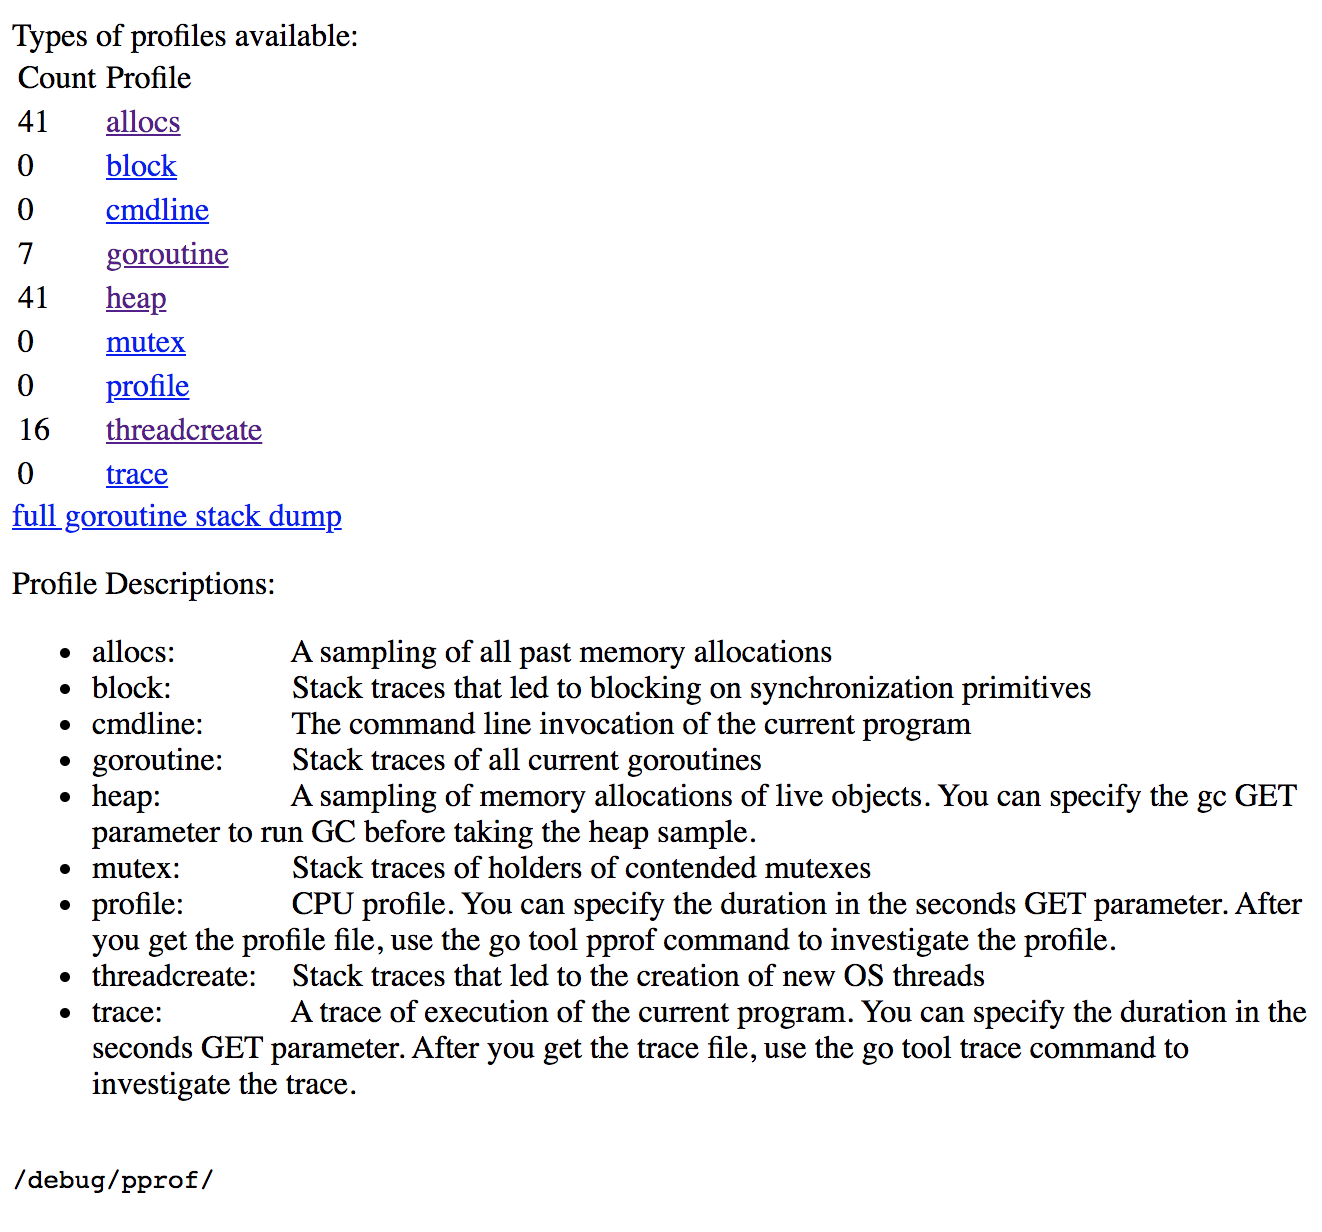
Let’s check the index page. Open 127.0.0.1:8081/debug/pprof/ in your browser. This page explains in details functional
of other pages, but we’re interested in profile and heap.
- profile - CPU Profile
- head - Memory Allocation Profile

Now you can run pprof for a while and check what was going on at this period. Let’s run CPU profiling for 30 seconds.
go tool pprof -http=":9090" -seconds=30 http://localhost:8081/debug/pprof/profile

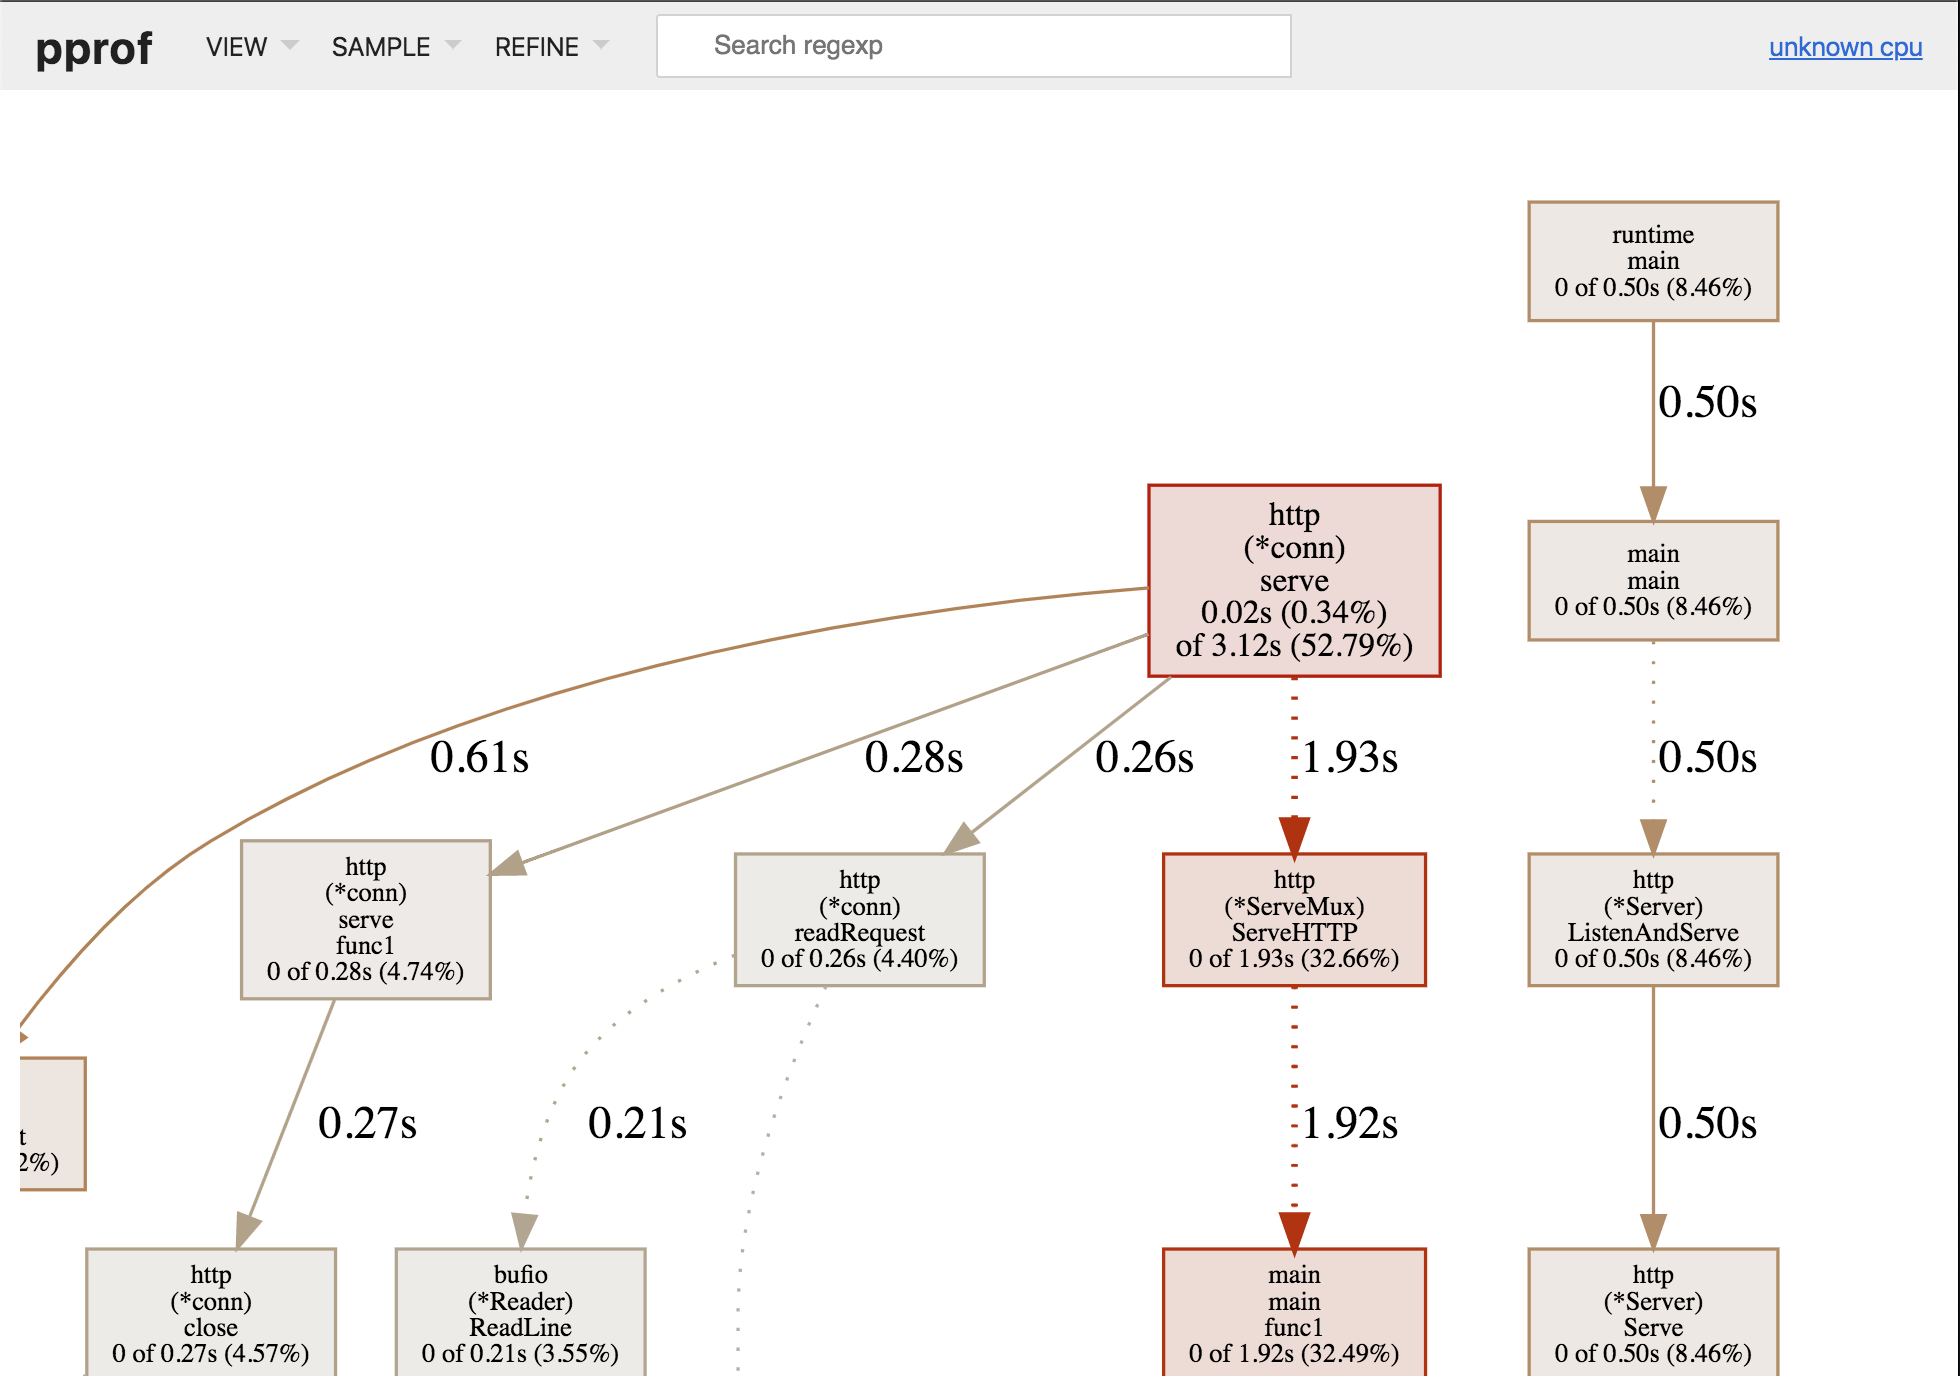
Each block looks like main generateRandomText 0.01s (0.17%) of 1.92s (32.49%) Where
- main - a package name
- generateRandomText - a function name
- 0.01s (0.17%) - how long the function takes the time (without processing called functions inside)
- 1.92s (32.49%) - how long the function takes in total
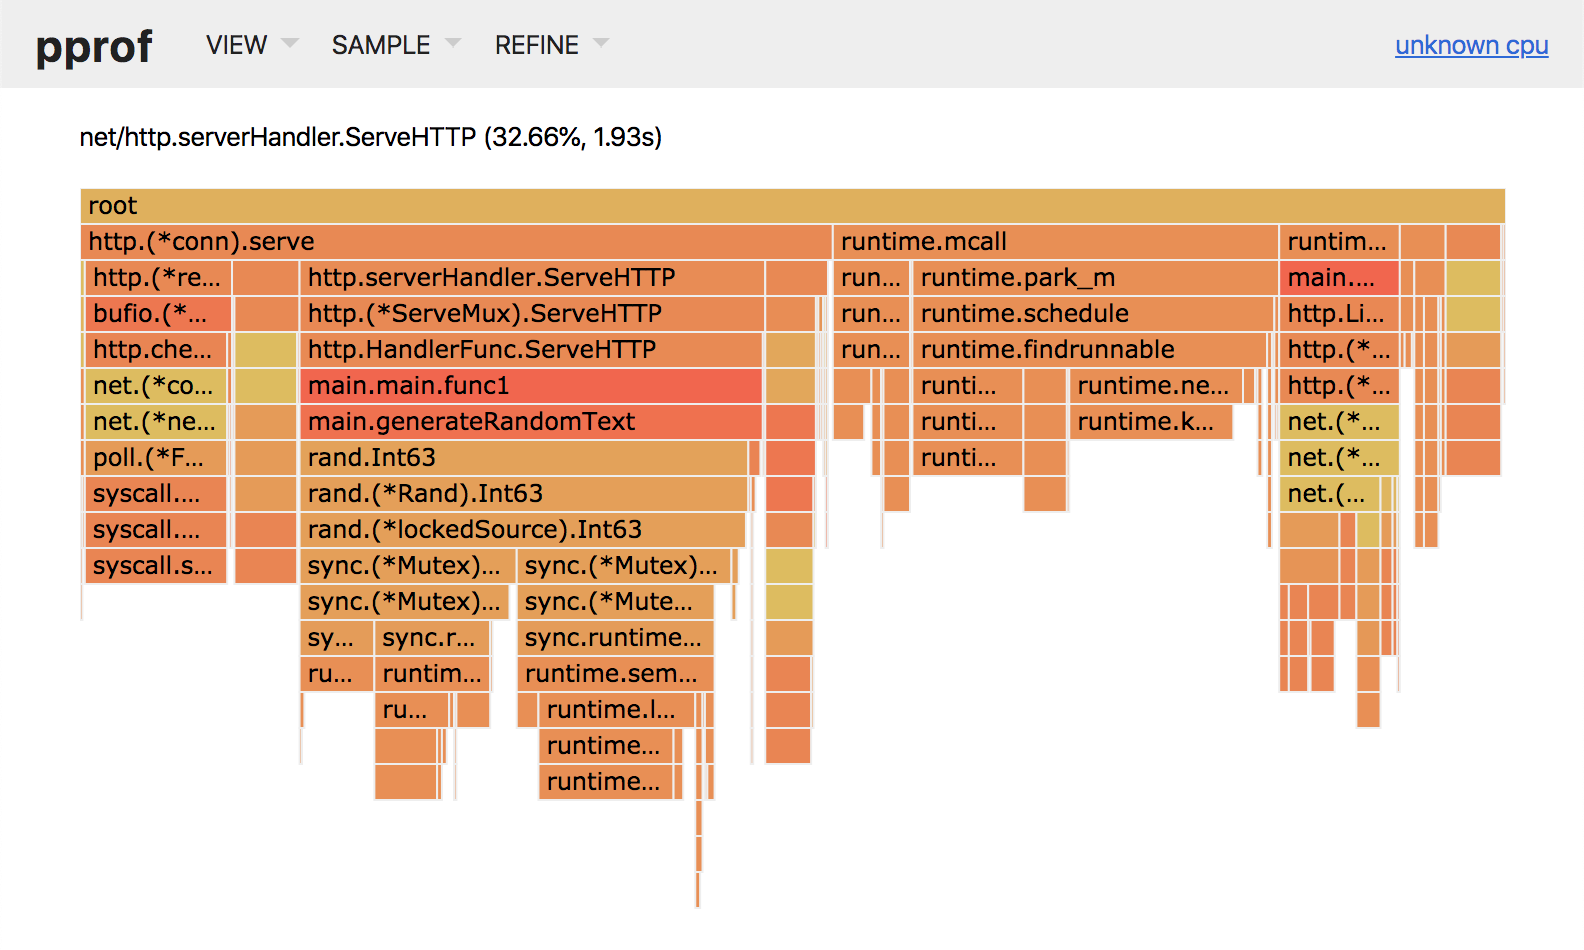
There is another useful presentation (my favorite) - Flame graph. The X-axis shows how long a function is working. The Y-axis shows call stack.

Conclusion
This is the tip of the iceberg. PProf is a powerful tool for profile golang applications (not only) which allows easily to find problems in your code.
P.S.
If you use Goland by JetBrains you are lucky to have the ability to run profile right from your lovely IDE. Check this out how cool it is.